At the start of our new Massive Open Online Course (MOOC), “The Science of Happiness,” we invited our more than 100,000 students to take our “pre-course survey,” which asks about their health, well-being, age, gender, and other background information. These details—all kept anonymous and confidential—provide a snapshot of our student body at the outset of the course.

So far, more than 20,000 students have completed the pre-course survey! Their participation enables us to tell our students about who is taking the class with them and to uncover some interesting trends about happiness. (And if you want to enroll in the course and take the survey, it’s not too late!)
This is the first in a series of posts reporting on findings from the survey, based on our analysis of all 20,000+ responses so far, covering group differences in happiness across age, gender, relationship status, and community standing.

Keep your eyes peeled for more posts as we continue to analyze the survey results. At the end of the class, we’ll invite all our students to take a final survey that will help us track students’ changes in happiness from the start to the end of “The Science of Happiness.”
Who is in “The Science of Happiness”?
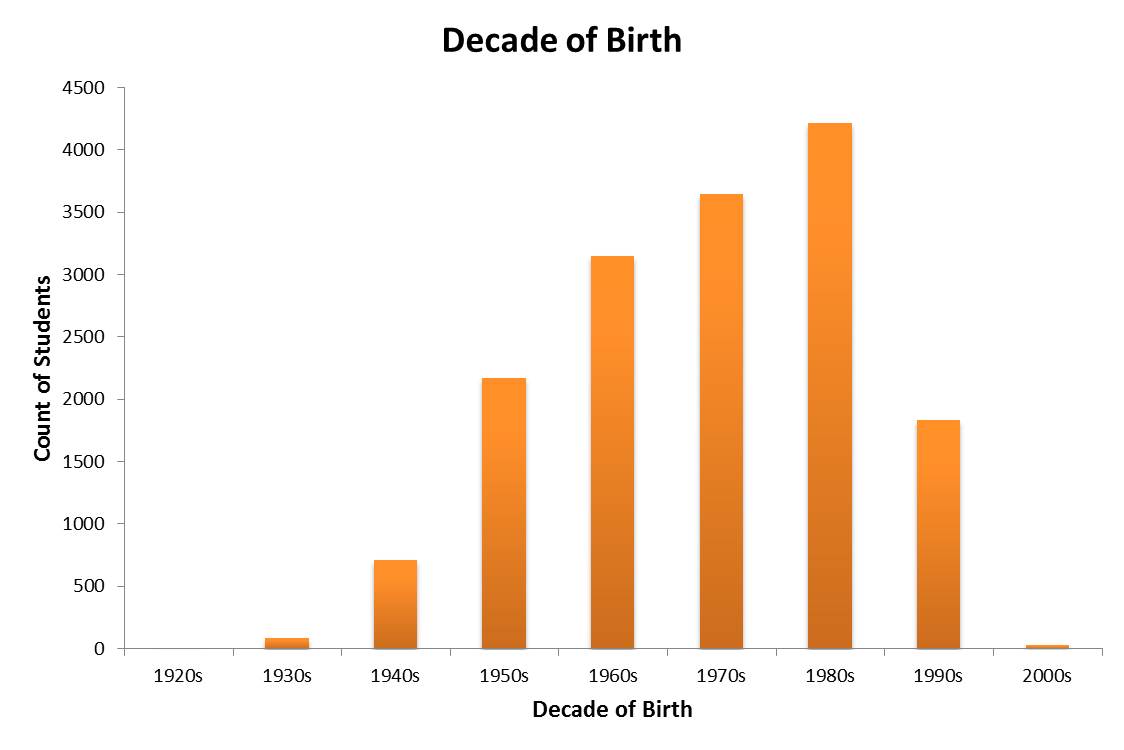
The survey reveals tremendous diversity among our students: They represent a range of age groups and countries from all over the world. (Note: findings regarding happiness across countries will be presented in a future post). In the figure below, you can see the age distribution of students in “The Science of Happiness.”
Who is happiest?
In addition to determining who is in “The Science of Happiness,” the data can also be used to address big questions about who generally experiences the most happiness.
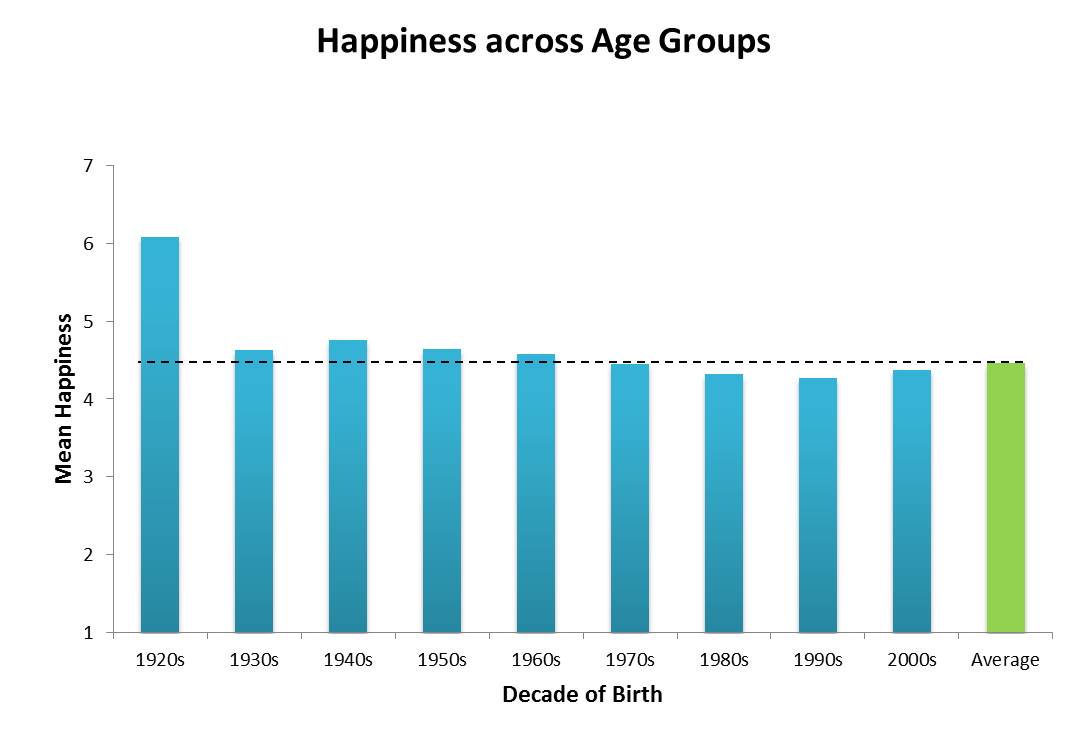
First, we tested whether students’ age is related to their happiness. Some past research has suggested that as people age, they experience more positive emotion. Our results offer some support for that finding—sort of. In the figure below, you can see that happiness increases marginally among older students, with a spike in happiness among participants born in the 1920s.
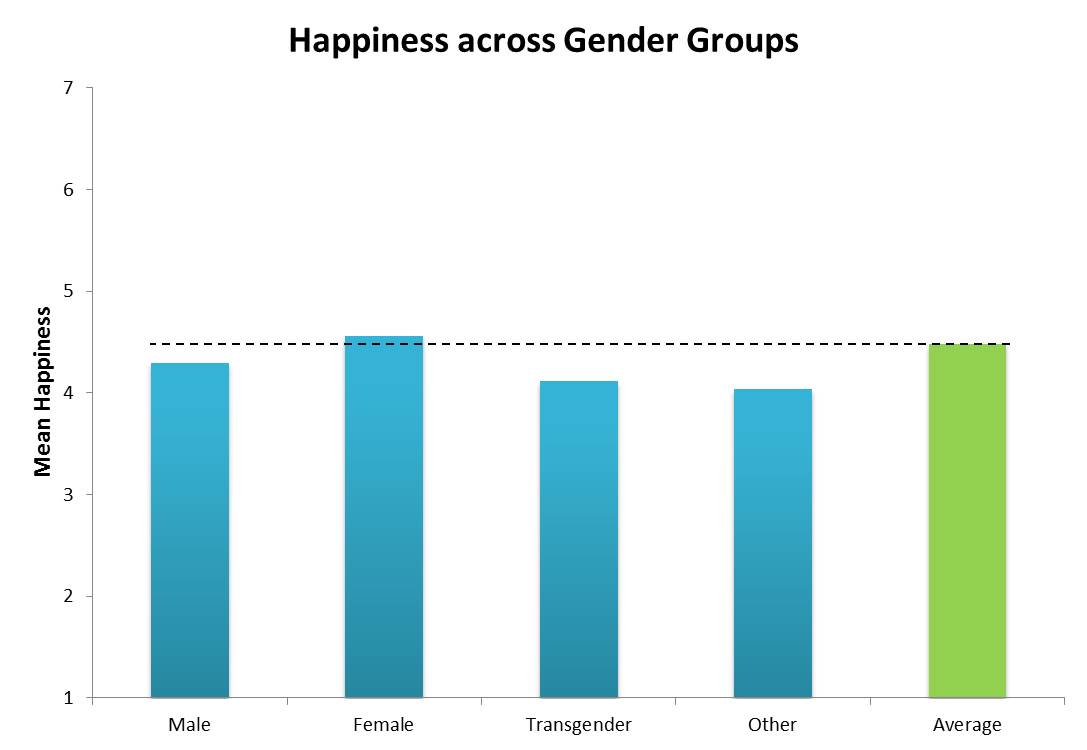
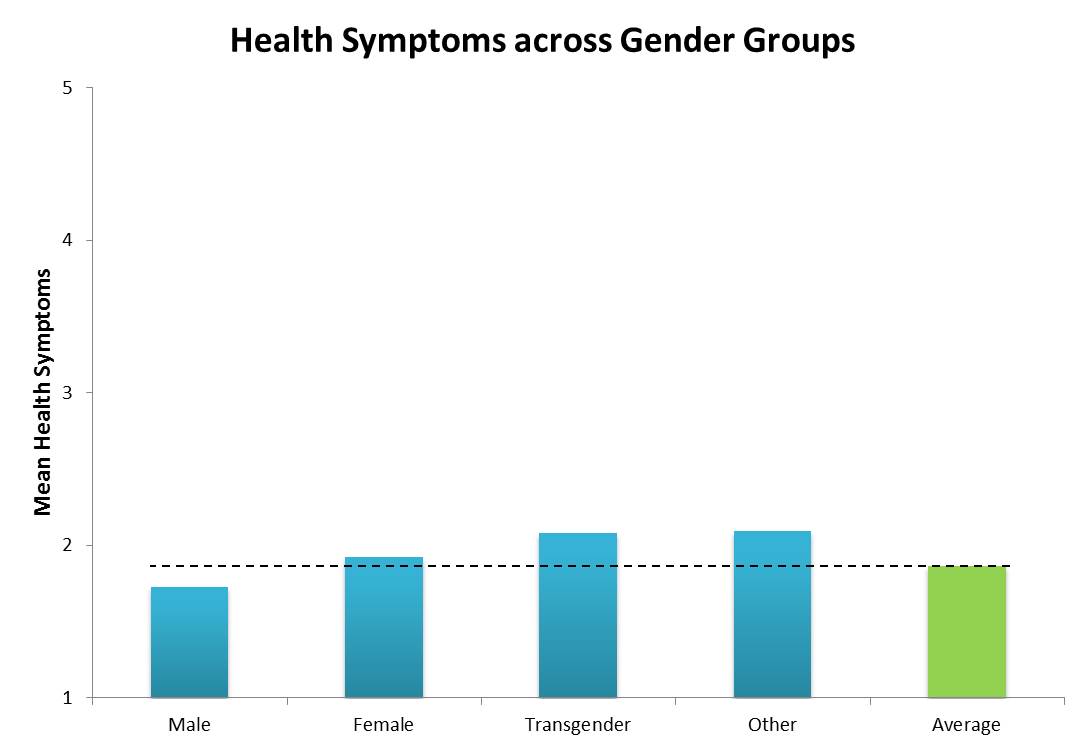
Second, we tested whether students’ gender is related to happiness and health symptoms. Past research has produced mixed results about which gender group is happier and healthier. As the figures below indicate, our data suggest that females in the class are somewhat happier than other gender groups, while males show somewhat fewer symptoms of health problems.
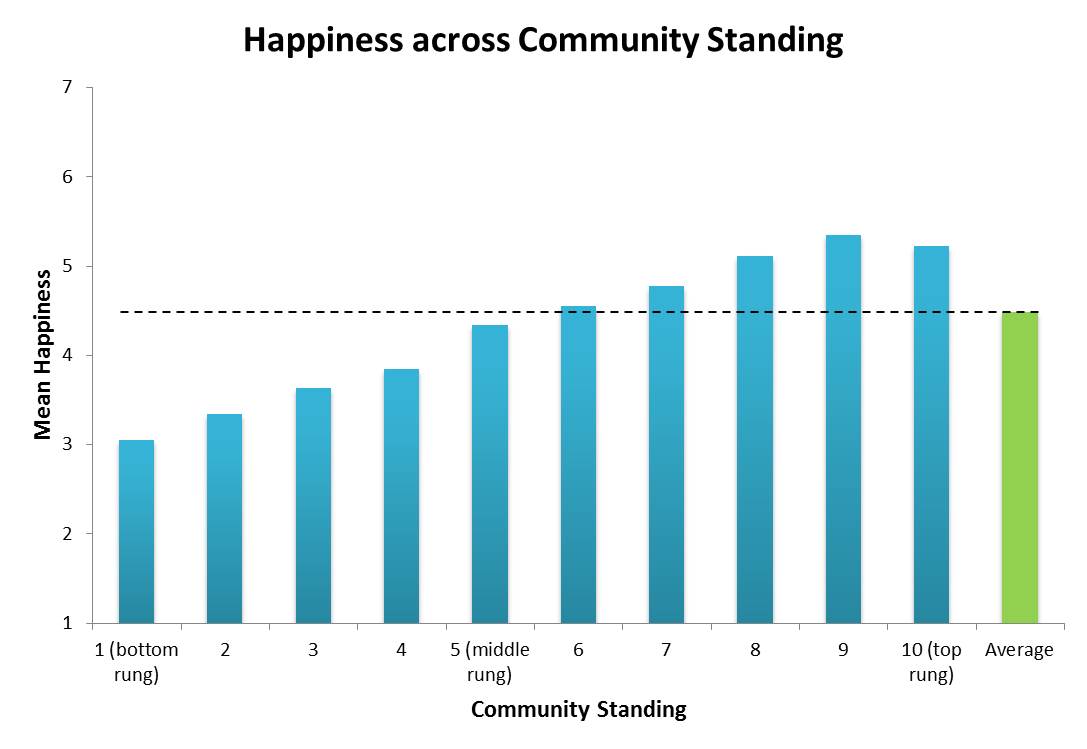
Third, we tested whether our students’ standing in their community is related to their happiness. “Community standing” was measured simply by presenting students with a ladder that was supposed to represent their community, with the highest-ranking members at the top and the lowest-ranking at the bottom. They had to indicate where they’d place themselves on that ladder.
Prior research suggests that higher community standing is associated with more generosity, being well-liked by members of the community, and a kind, helpful (or “prosocial”) orientation. Our survey data suggest that community standing is also positively associated with happiness.
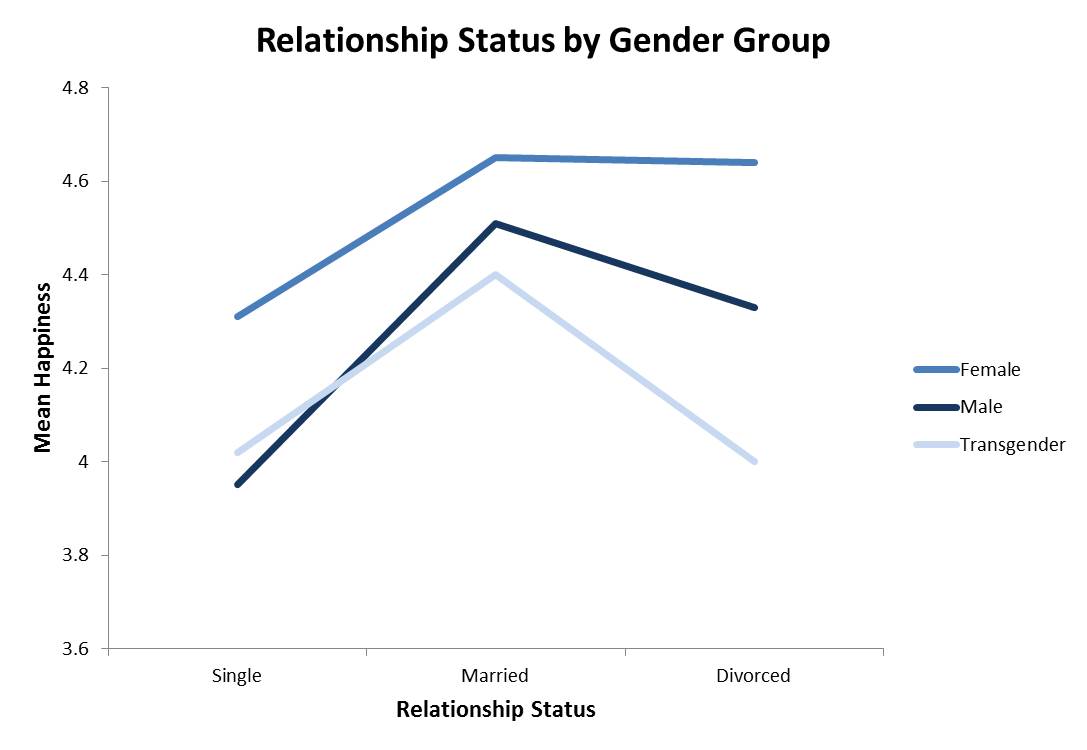
Lastly, we tested whether students’ relationship status is associated with their happiness, and examined how this association might differ across genders. Some past research has suggested that females (versus males) show lesser increases in happiness from being married, though that was not evident in our data.
Week 2 of the course will cover research on the relationship between marriage and happiness. Keep an eye out for more findings from our survey.


Comments