To what extent is happiness related to where you live? Which countries have the most—and least—happy residents? Are residents of wealthier countries happier?
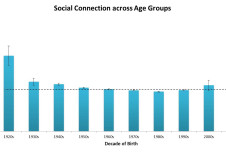
These are some of the questions we considered when analyzing data from the survey we presented to the 112,000 students who registered for our online course, “The Science of Happiness.” So far, more than 40,000 students, hailing from over 200 countries and areas of sovereignty around the world, have taken the survey. Previously, we reported on how students’ happiness levels relate to factors like age and gender, and how some of those same factors relate to students’ levels of social connection.
This time around we’re examining how happiness relates to students’ geographic location. To do so, we looked only at data from the 58 countries with at least 25 students who completed the survey. The countries with the largest representation are the United States (home to roughly half of the students who completed the survey), then Canada, Australia, the United Kingdom, and India.

It is important to keep in mind that we can’t make generalizations about a country as a whole based on a small sample of its residents, especially since the people enrolled in our happiness course are not a representative sample of the entire country’s population. Nonetheless, we can at least gain some insights about the students taking this course.
So which countries are the happiest?
Topping the list is Costa Rica, a small country in Central America known for its natural beauty and progressive environmental and social policies. This finding is not surprising—Costa Rica often ranks high in cross-national measures of happiness. It is not a particularly wealthy country in terms of Gross Domestic Product (GDP), but as instructors Dacher Keltner and Emiliana Simon-Thomas discuss toward the beginning of “The Science of Happiness,” GDP may not be the best indicator of national well-being. The per capita GDP of the United States is about four times higher than that of Costa Rica, but the United States ranks only 16th for subjective happiness, based on our data.
After Costa Rica, next on the list are Croatia, Chile, Malaysia, and Colombia, countries that, like Costa Rica, are not particularly high in GDP. Although our data can’t tell us exactly why residents of these countries are the happiest, we can speculate that factors other than income may be at play. One clue is that these five countries are also among the lowest 10 in loneliness (meaning that their residents are less lonely than most other students in the course), and among the top 10 in social connection, suggesting that strong social ties may trump income when it comes to happiness.
Surprisingly, Scandinavian countries, which tend to rank highest on subjective happiness in other studies, are not among the highest in subjective happiness in our sample. However, Finland does rank 15th in subjective happiness, and Denmark ranks 19th. Denmark also ranks second for lowest loneliness and 10th for lowest stress, and Sweden ranks 8th in perceived stress and 9th in life satisfaction. The discrepancy between our findings and prior research could be related to the fact that students enrolled in “The Science of Happiness” are not a representative sample, but rather a group of individuals who have a particular interest in the study of happiness.
Geographical differences in happiness may be due in part to cultural differences. Collectivist cultures—those that emphasize group cohesion and shared goals—may rank higher in social connectedness and lower in loneliness due to these cultural values. Individualistic cultures, by contrast, may rank higher on happiness measures that tap into personal accomplishments and self-esteem. The United States, for example, ranked 6th in flourishing, a measure that includes several items focused on individual accomplishments (e.g., “I am competent and capable in the activities that are important to me.”).
Below is a map indicating the happiness levels by country. The color and shading of each country reflects the average score of its residents on the “Subjective Happiness” scale administered to students in “The Science of Happiness.” The scale runs from one (least happy) to seven (most happy). If you click on a country, a box will pop up indicating the number of students who completed the survey and their average happiness score.
While only countries with more than 25 students who completed the survey appear on the final rankings below, countries with any surveyed students appear on the map. If no residents of a country (e.g., North Korea) completed the survey, that country is not labeled on the map. You can use the + and - buttons to zoom in and out on the map, and use the search box to find a specific country.
You can also view this map in full screen mode and share it with others.
Here are the lists of the countries that scored toward the top of several measures of well-being included on our survey at the start of “The Science of Happiness.” These lists only include countries with at least 25 students who completed the survey.
Subjective Happiness
The Subjective Happiness Scale was used to assess global, subjective beliefs about whether one is a happy or unhappy person, independent of specific bases of happiness or unhappiness, such as positive and negative life events or circumstances. Sample item: “In general I consider myself a very happy person.” Top 25 countries:
1. Costa Rica
2. Croatia
3. Chile
4. Malaysia
5. Colombia
6. Switzerland
7. Thailand
8. Czech Republic
9. Philippines
10. Bulgaria
11. Mexico
12. Peru
13. Canada
14. New Zealand
15. Finland
16. United States
17. Spain
18. Australia
19. Denmark
20. United Arab Emirates
21. Romania
22. South Africa
23. India
24. Ukraine
25. Venezuela
On the flip side, students from these 10 countries scored the lowest on the happiness scale: Iran, Serbia, Egypt, Pakistan, Russia, Scotland, Saudi Arabia, Latvia, England, and Poland.
Life Satisfaction
The Satisfaction with Life Scale was used to assess people’s appraisals of the overall conditions of their lives. Sample item: “In most ways my life is close to my ideal.” Top 10 countries:
1. Costa Rica
2. Chile
3. Thailand
4. Colombia
5. Switzerland
6. Ecuador
7. Czech Republic
8. Austria
9. Sweden
10. Malaysia
Students from these 10 countries scored the lowest on the life satisfaction scale: Serbia, Iran, Egypt, Russia, Turkey, Poland, Pakistan, England, Italy, and Ukraine.
Flourishing
The Flourishing Scale was used to assess well-being across a range of domains, including self-esteem, meaning and purpose, relationship functioning, and optimism. Sample item: “I live a purposeful and meaningful life.” Top 10 countries:
1. Costa Rica
2. Chile
3. Thailand
4. Colombia
5. Switzerland
6. United States
7. Philippines
8. Mexico
9. Croatia
10. Canada
Students from these 10 countries scored the lowest on the flourishing scale: Russia, Iran, Poland, Egypt, Japan, Indonesia, Turkey, Italy, Lithuania, and Ukraine.
Social Connection
We assessed social connection by asking people to rate how closely they see themselves in relation to the people they encounter in daily life, as represented by a series of circles that overlap to various degrees. Higher scores on this measure, the Inclusion of Other in the Self Scale, are indicated by greater overlap between the “self” and “other” circles. Top 10 countries:
1. Bulgaria
2. Pakistan
3. Croatia
4. Thailand
5. Philippines
6. Costa Rica
7. Chile
8. India
9. Malaysia
10. Spain
Students from these 10 countries scored the lowest on social connection: Lithuania, Ecuador, Iran, Saudi Arabia, China, Japan, Norway, Russia, Slovenia, and Hungary.
Loneliness
The UCLA Loneliness Scale was used to assess people’s subjective feelings of loneliness and social isolation. Sample item: “I feel in tune with the people around me.” The 10 countries listed below scored lowest on this scale.
1. Croatia
2. Denmark
3. Hungary
4. Thailand
5. Colombia
6. Chile
7. Costa Rica
8. New Zealand
9. Germany
10. Slovenia
Students from these 10 countries scored the highest on the loneliness scale (meaning they’re the most lonely): Pakistan, Iran, Saudi Arabia, Eqypt, United Arab Emirates, Vietnam, Russia, Ecuador, Indonesia, and Malaysia. (Interestingly, Malaysia is the one exception to the point I made above, that social connection is inversely related to loneliness—it is the one country that scored in the top 10 in both social connection and loneliness.)
Perceived Stress
The Perceived Stress Scale was used to assess the degree to which people find their lives to be unpredictable, uncontrollable, and overwhelming. Example item: “In the last month, how often have you felt that you were unable to control the important things in your life?” The 10 countries listed below scored lowest on this scale.
1. Thailand
2. Costa Rica
3. Malaysia
4. Switzerland
5. Croatia
6. Chile
7. New Zealand
8. Sweden
9. Colombia
10. Denmark
Students from these 10 countries scored the highest on perceived stress: Egypt, Iran, Vietnam, Indonesia, Pakistan, Serbia, Turkey, Argentina, Russia, and Singapore.
Don’t see your country on these lists? This may be because fewer than 25 students from it took the pre-course survey, making it difficult for us to generalize about students from that country. For example, South Korea actually scored higher than Costa Rica in subjective happiness but just missed the cut-off for our analysis, with 23 students represented. Many other countries (e.g., the nation of Dominica) had only one or two students represented, but some of these individuals reported the highest levels of happiness possible on the scale.


Comments